
2D and 3D visualisation
View your site in both 2D and 3D perspectives using Glint Solar. Generate images to effectively communicate your plans with colleagues, partners, landowners, and authorities.
How to use 2D and 3D visualisation
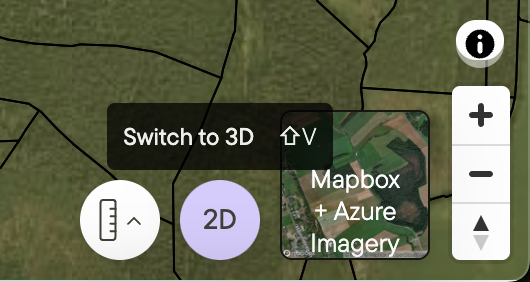
Switch between modes by clicking the 2D or 3D button in the bottom right corner.
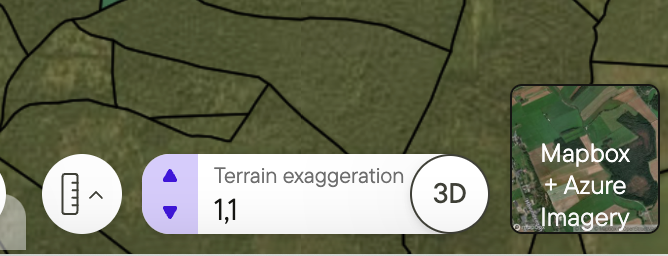
In 3D mode, you can adjust the terrain exaggeration to enhance or reduce the visibility of topographical features.
 |  |
Export map view
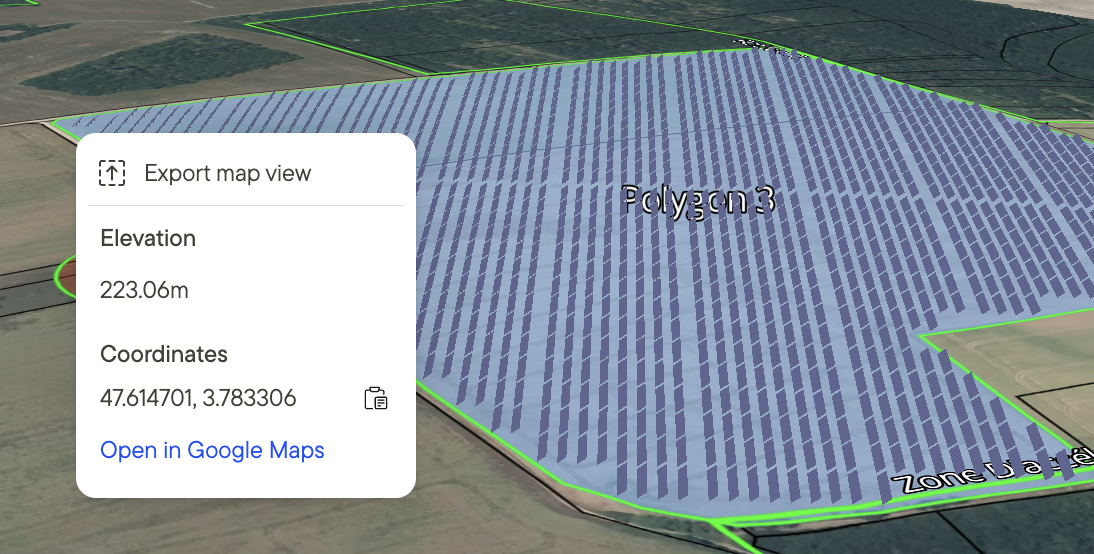
Right-click on the map in either 2D or 3D view to export an image.
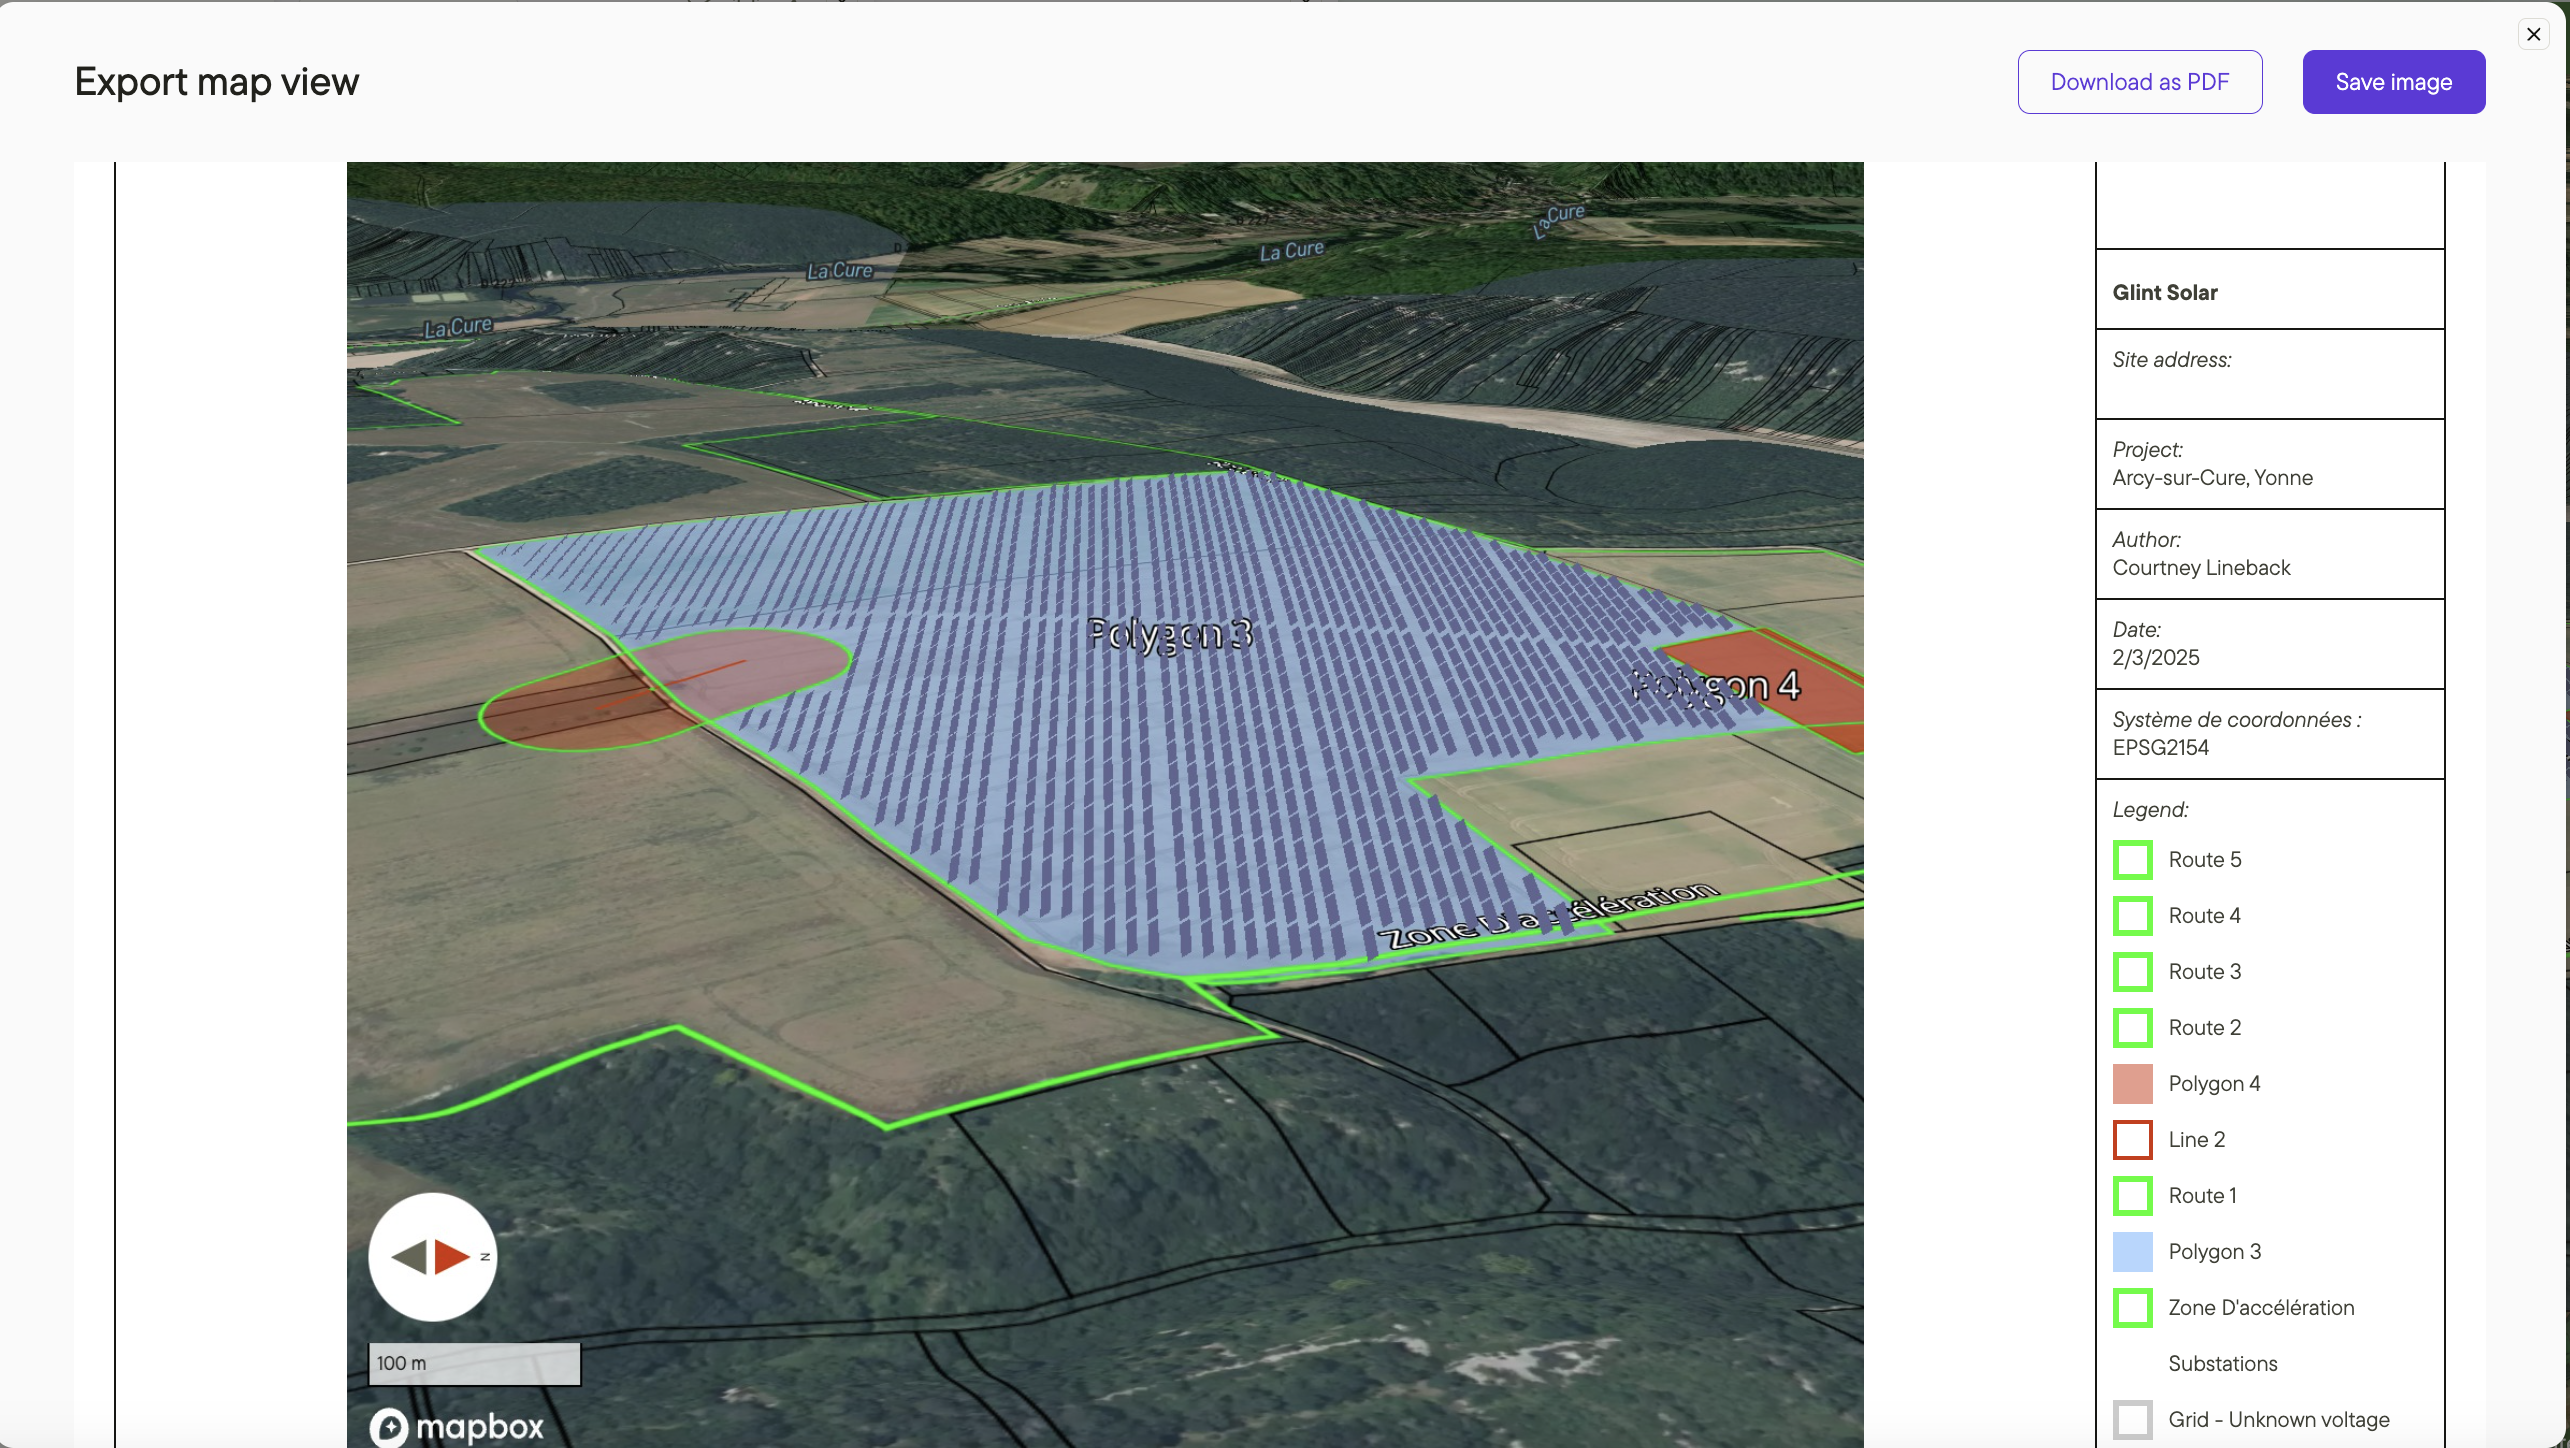
Learn more about including data layers and configuring the map view export here.
Visualizing layers
Any layers you've added to your layers list will appear in both 2D and 3D visualizations.
Analysis report
Each analysis report includes three images:
- A global location overview
- A 2D view of all project objects
- A 3D visualization of the site
Additional resources
Do you want to import a project instead of a layer? Read the article about importing projects here.
Do you want more details on how to import data as a layer? Read about this here.
Curious about the images in the analysis report? Read more here.
Read more about adding data from the layers library and using your layers list here.