
PV analysis - Methodology and data sources
As a user it is important to know what Glint Solar calculates and how it calculates. Below is a clarification of the key terms and methods used for calculation in Glint Solar.
Scroll down to the Additional resources bottom of this page for links to related concepts and explanations.
Abbreviations and terminology
- GHI: Global Horizontal Irradiance
- DNI: Direct Normal Irradiance
- DHI: Diffuse Horizontal Irradiance
- PoA: Plane of Array
- STC: Standard Test Conditions
Read more about these concepts here
PV system
Installed capacity - DC: This is the PV module installed capacity, given in Wp. Note, only front side capacity is considered here. That is, the bifacial capacity is not added. This signifies that the total production can be higher than the capacity mentioned here.
Installed capacity - nominal AC: This is the total installed nominal AC capacity of the inverters. It is calculated by dividing the installed DC capacity with the DC-AC ratio. Note for analyses with the "advanced" inverter option: It is the nominal AC power, not the Max AC power.
Specific yield: Specific yield is defined as (first year yield) / (installed DC capacity), expressed in kWh/kWp. What "first year yield" refers to depends on what you are looking at. If you look at the system level, the specific yield is what is exported to grid. If you however enter a PV part of a hybrid analysis, "first year yield" means the PV production. Note that if running a full hybrid analysis, you will only see the "PV specific yield", since the specific yield terminology lose its value when you have a BESS importing energy from the grid.
First year production (P50): The bifacial production is included here (if it is enabled). For the bifacial gain, see the losses diagram further down. The first year production is the yearly average. Glint calculates the energy production for each time step for each year. Glint uses 15 year as default (see “Irradiation data” below to see which years that applies for your region). The number presented in the report is hence the average of the yearly energy production. Since we assume weather data is normal distributes (Gaussian), this production will be a P50 estimation.
P90: P90 is calculated when choosing the "Automatic" irradiation data source - this is not yet available for Meteonorm or Solargis. The P90 is calculated by using a set of different variabilities. The variabilities and procedure are inspired by PVsyst, so that a comparison is feasible.
- Year to year production variability; The weather varies from year to year, and the production will hence vary. This the most important contribution, and is dependent on the location and the configuration. This is the same as the presented "Average variability".
- PV module modelling: 1%
- Inverter efficiency: 0.5%
- Soiling mismatching: 1%
- Degradation estimation: 1%
These variabilities are then propagated using the root-sum-square (RSS) method. Further, we assume a Gaussian distribution for all these contributions. Hence, a P90 uncertainty can be obtained by multiplying the losses with 1.282. It is first now a P90 estimation is possible:
P90 = P50 (1- P90 uncertainty)
Average variability: The average variability is the standard deviation of the annual energy production. In other words, it is a measure of how dispersed the yearly energy production is in relation to the mean.
Data sources
A PV calculation requires detailed climate data in order to achieve an accurate result. Glint is using three different data sources: one source for general climate data and specific irradiation, one source which includes Meteonorm v8.2 as an option for both irradiation and climate data, and another source which uses Solargis data as both irradiation and climate data.
Climate data - ERA5
Glint uses the ERA5 hourly dataset for general climate data. This dataset is published by the Copernicus project and is widely recognized and used across research and industry. See more details about the dataset here.
Irradiation data
For irradiation data, Glint prioritizes using mostly satellite-derived datasets (i.e not ERA5). Where we do not have any satellite-derived dataset, we fall back to ERA5 dataset for irradiation. The different regions and its respective dataset is the following:
- For Europe and Africa: CMSAF (SARAH-3.0) - data: 2010-2025, temporal resolution: 30 minutes)
- For Asia west: CMSAF East (SARAH-E 1.0) - data: 2002 - 2016, temporal resolution: 2 hours
- For Asia east: Himawari - data: 2011 - 2020, temporal resolution: 1 hour
- For North and South America (until 21 degrees south): NSRDB - data: 2006 - 2020, temporal resolution: 1 hour
- Other: ERA5 - data: 2006 - 2020, temporal resolution: 2 hours
Additionally to the automatic option, Glint offer the option to use Meteonorm, SolarGis and SolarAnywhere for irradiation calculations.
GHI bias for SARAH-3.0
All irradiation data sources has a bias when they indicate the historical irradiation on a certain location. This bias differs from location and location, e.g the SARAH-3.0 has a lower bias in Germany.
When SARAH-3.0 data source is selected in Glint (i.e if the selected data source is either the "Automatic" or "Automatic - TMY" in Europe), Glint has together with The Norwegian Institute for Energy Technology (IFE) provided an analysis of what this bias is for different regions in Europe.
This bias could help you as a developer to get an impression of how accurate the irradiation data is for your given country. E.g if the indicated GHI is 1000 W/m² at a location where the average bias is +3%, it would be more probable that the actual irradiance is 970 W/m². It is always important for developers to be aware over the accuracy of their irradiation data, because the irradiation is the most important variable when it comes to predicting the solar production in the end.
Glint recommends developers to run their analyses with several irradiation data sources, so that you would get more data points and a higher certainty of what the actual irradiance will be.
The numbers are achieved by combining quantitative statistical metrics with qualitative regional analysis to account for satellite modeling limitations, from the study "Extensive validation of CM SAF surface radiation products over Europe" (Urraca et al., 2017; https://doi.org/10.1016/j.rse.2017.07.013). Mean Bias Error (MBE %) values are used to provide a quantitative description of data reliability.
Reasons for Uncertainty:
- Snow: Significant interference with cloud detection in Scandinavia, the Alps, and Eastern Europe.
- Topography: Irradiance is averaged over a pixel, which fails to capture sub-pixel terrain variations in the Alps.
- High Latitudes: Oblique viewing angles in Scandinavia cause uncertain cloud projection (parallax displacement).
- Aerosols: Deviations from static monthly climatology, particularly during Saharan dust events in Southern Europe.
- Validation Density: Regional reliability depends on the availability and quality of ground-based sensor networks.
Current Regional Data (with GHI mean bias error values) values:
- Central Europe: +1%
Sources: Monthly mean SIS (Surface Incoming Shortwave) against BSRN (Baseline Surface Radiation Network) and sunshine duration against CLIMAT in the SARAH-3 validation report. - Scandinavia: -1 %
Sources: SARAH-3 validation in Thøgersen et al. (2024) and monthly mean SIS against BSRN and sunshine duration against CLIMAT in the SARAH-3 validation report. 3. Non-snowy and non-horizon shaded stations south of 65°N in Riise et al. (2024). - Eastern Europe: -1 %
Sources: Monthly mean SIS against BSRN and sunshine duration against CLIMAT in the SARAH-3 validation report. - The European Alps: 0 %
Sources: High altitude stations from Buffatt et al. and Schuurman and Meyer (2025) and monthly mean SIS against BSRN and sunshine duration against CLIMAT in the SARAH-3 validation report. - Southern Europe: +3%
Sourves: Monthly mean SIS against BSRN and sunshine duration against CLIMAT in the SARAH-3 validation report.
Meteonorm version 8.2
Meteonorm is integrated into Glint as an alternative data source for both climate and irradiation data. Meteonorm provides a comprehensive dataset for meteorological variables and solar radiation. The user has the flexibility to choose either the default option, which utilizes ERA5 for climate data and satellite-derived data for irradiation, or opt for Meteonorm as the irradiation and climate data source. For more information about Meteonorm, visit their website here.
With these data sources, users have the freedom to tailor their PV calculations by selecting the preferred data source, allowing for more accurate and customized results based on their preferences and requirements.
Note: PVsyst is using Meteonorm version 8.1, so results may vary.
Note: When using this data source for an analysis, the annual variability is not relevant since a TMY is being used.
Solargis
Glint allows the usage of Solargis as a data source. In order to analyse with Solargis, a monthly data file in the correct format must be uploaded. The file must include values for latitude and longitude as well as GHIm and T24 columns each with 12 values — each of these values representing a calendar month. The data is employed to generate a synthetic TMY (Typical Meteorological Year) via the Meteonorm API.
Note: When using this data source for an analysis, the annual variability is not relevant since a TMY is being used.
SolarAnywhere®
If you are also a SolarAnywhere user, you can also use your SolarAnywhere API key or .csv files to run analyses directly in Glint.
For more detailed instructions, please refer to this page. For more information about SolarAnywhere® irradiation data, please refer to the official website here.
Calculation methodology
Glint uses the PV_LIB framework as the foundation for the PV yield calculations. PV_LIB was initially developed by Sandia National Laboratories, but has since been offered as an open-source software project. It has been validated and is currently used extensively in research and industry. See more details here.
Calculation aspects
Decomposition model (estimate DNI from measured GHI): N/A - Glint extracts DNI directly from data source
Transposition model (estimate PoA irradiance from measured GHI): Hay/ Davies
Bifacial gain model: Pvfactors.
Other:
- We assume flat ground, even if the map is showing sloped terrain
- We do not consider the PV geometry. We calculate how much AC power one panel produces, and multiplies this with the total amount of panels.
Single axis trackers
The user may choose to use single axis trackers in the pv analysis. Glint enables by default backtracking in the tracking algorithm. Backtracking is when the trackers are controlled so that the row do not shade the row behind. In result, there will be no direct shading on the rows. However, there will still be near-sharing losses - the rows are shading the diffuse irradiation.
The max tracker angle is set to 60 degrees.
Inverter
You can add a specific inverter to your configurations. You may also specify the DC/AC ratio and the general inverter efficiency.
The DC-AC ratio is the ratio between installed DC capacity (solar cells produce DC power) and the power rating of the installed inverter. A DC-AC ratio over 1 means that it is a higher DC installed capacity than the available inverter rating. I.e at full pv production, the inverter cannot process 100% of the power. When the inverter cannot handle all the pv production, this will result in an inverter clipping loss. See the illustration below for how DC-AC ratio and inverter clipping losses are connected.
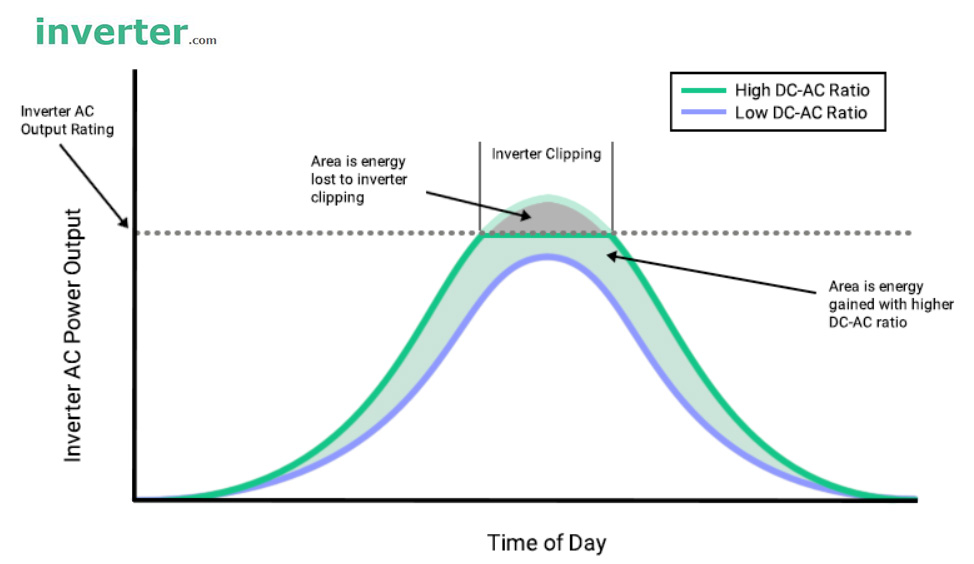
https://www.inverter.com/what-is-solar-inverter-clipping
Hourly Heatmap
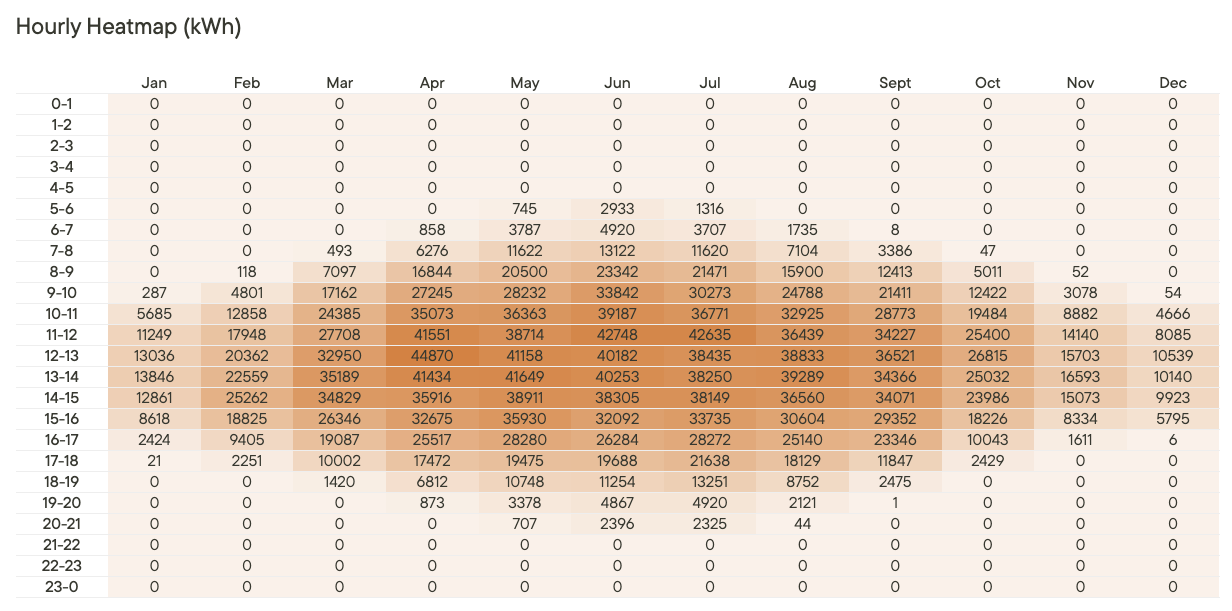
The hourly heatmap analysis presents average yield values in kWh by hour for each month, with data originally in Coordinated Universal Time (UTC). To ensure accuracy, it computes a time zone offset accounting for Daylight Saving Time (DST) rules applicable, aligning the heatmap with the local time zone at the analysis's creation. Darker heatmap cells indicate high-yield periods, while lighter cells signify lower yields. Users can gain insights into yield patterns, time-of-day effects, and seasonality, aiding resource allocation and decision-making. The analysis provides valuable, localized information, taking into account DST adjustments for accurate interpretation.
Losses
In the PV calculation, there are two different aspects of losses. The losses provided by the user (in profile settings), and the losses calculated in the calculation.
The calculated losses are presented in the “Losses” diagram in the report. These delta values are values compared to STC (standard test conditions). Some values therefore might be positive, i.e an energy gain. There are also other small losses in the process which are not included in this illustration.
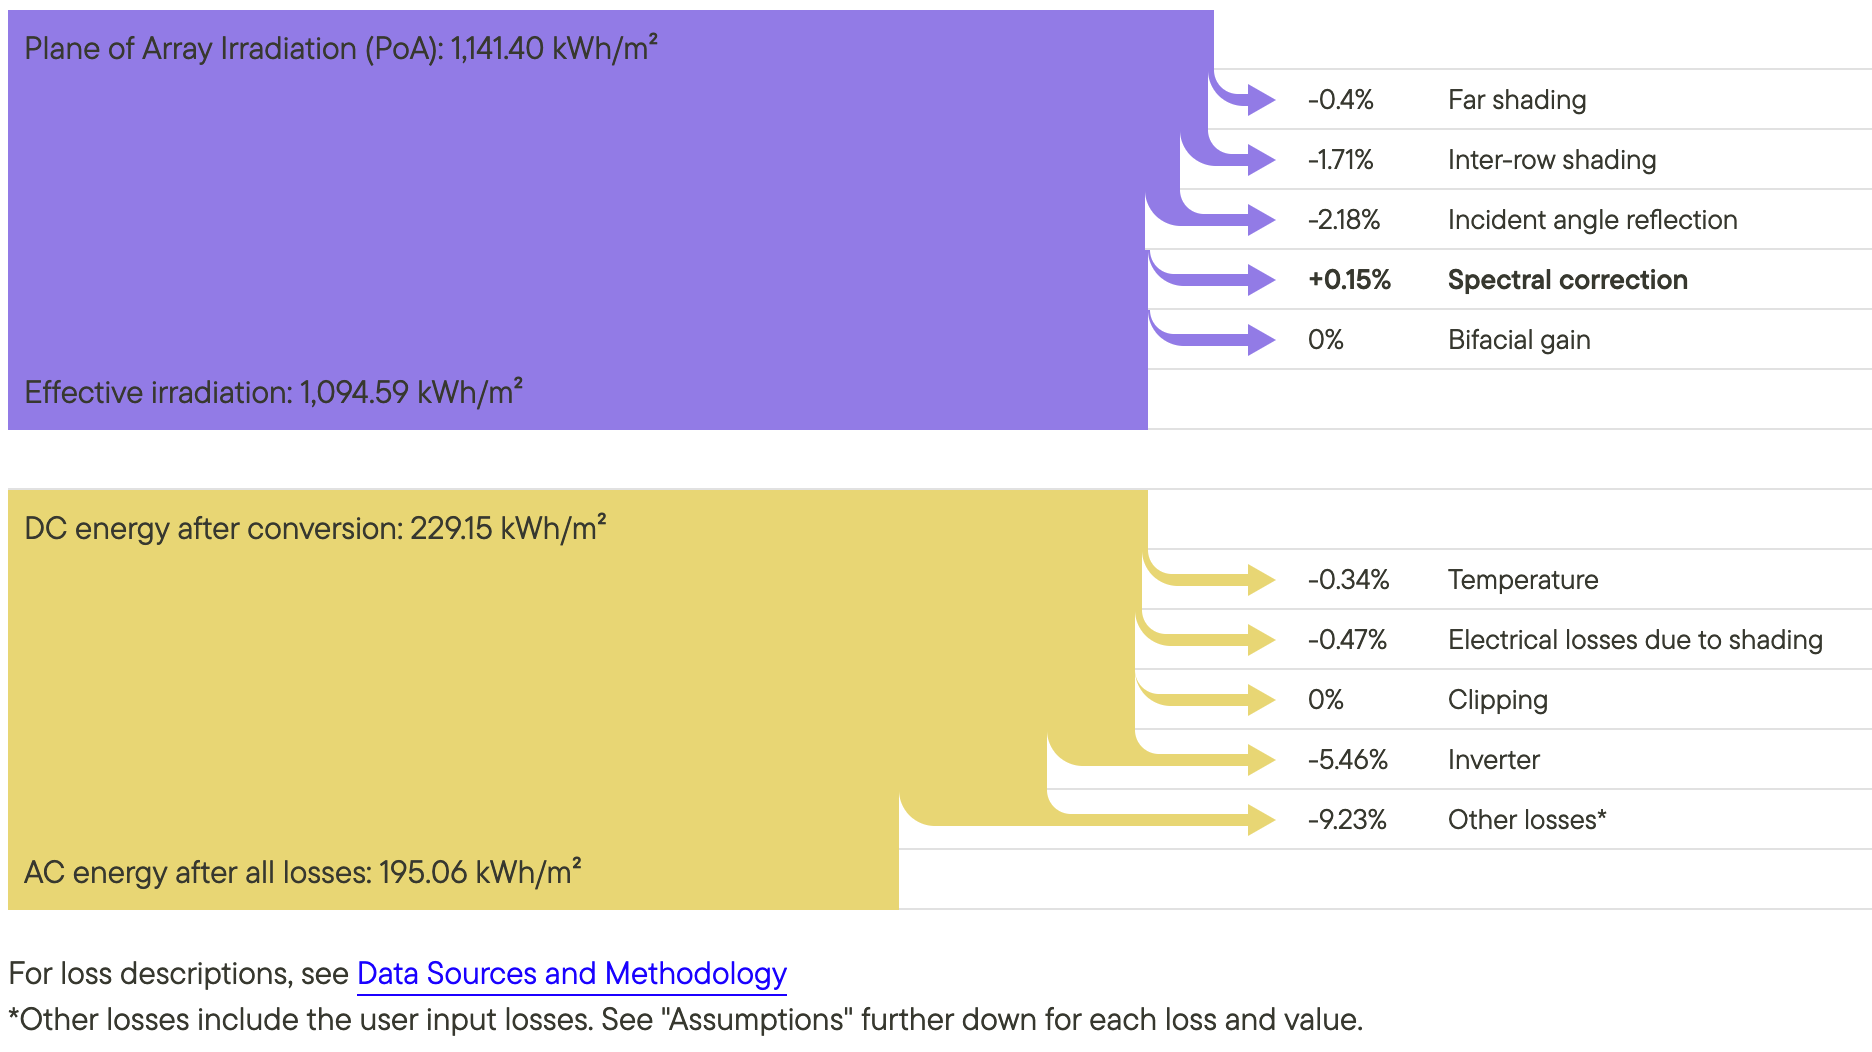
Far shading: Glint has implemented a far shading algorithm, which calculates the shading losses from the surrounding, distant terrain. For instance, this is useful when there are mountains around a site, or the site is located in a valley. Note: This is not “near shading”; if the shading terrain is in close proximity of the site, this shading is not included.
Inter-row shading: The lost irradiation due to inter-row shading. See the page about inter-row shading under “irradiation losses due to inter-row shading” for details.
Incident angle reflection: Unless the PV array is mounted on a two-axis tracker, the incident angle for the direct component of the solar radiation will not be normal except for a few rare instances, depending on the orientation. When the angle of incidence is greater than zero, there are optical losses due to increased reflections from the module materials that need to be quantified.
There are two IAM components: Direct IAM losses and diffuse. In Glint’s calculations, it is assumed that the panel has an anti-reflecting (AR) coating.
Spectral mismatch: A spectral mismatch correction factor is utilized to correct the spectral mismatch between the PV reference solar cell and the actual conditions. STC in laboratories have a different spectral response than the sun. There is therefore a spectral mismatch between the actual ground conditions and in laboratories. NOTE: The spectral mismatch correction can also be positive. In this case, it is actually a energy gain (compared to STC values).
Bifacial gain: The added irradiation of the rear side, after taking into account the bifaciality factor. Read more about the used bifacial algorithm here: Bifacial gain
Temperature: Under STC, the reference cell temperature is 25 degrees Celsius. Cell temperature affects the performance, and is dependent on factors such as ambient temperature, isolation technology and wind. NOTE: Some conditions can yield a positive energy gain, compared to STC. If the cell temperature is below 25 degrees (which is the reference temperature in STC), the performance will increase.
Electrical losses due to shading: The electrical losses due to inter-row shading. See the page about inter-row shading under “Electrical losses due to inter-row shading” for details.
Clipping: Clipping losses are a direct consequence of the DC-AC ratio. See explanation on the clipping and clipping losses earlier in this article. A higher DC-AC ratio will imply a higher clipping loss.
Inverter: The inverter efficiency is never 100%. The inverter losses are energy lost in the inverter.
Other losses: The other losses are the ones the user inputs in the profile settings. Read more about these losses here: Losses
Additional resources
For more information on configuring your PV settings in Glint Solar, see Adjusting the PV settings
Learn more about the technical concepts described above in the Solar Site Planning Guide:
For information on losses recorded in Glint Solar and how those losses are recorded in PVsyst, see Losses in Glint vs. losses in PVsyst.