
Adjusting the PV configuration
Glint Solar gives you flexibility to adjust your PV configuration and fine-tune the layout of your site. Create ready to use profiles to complete designs in minutes.
There are several factors to take into account when optimizing the system design to minimize loss, and many ways to mitigate these factors. For example, to avoid loss from shading, choose a location with few or no existing shade obstacles, ensure that there is sufficient space between modules to minimize inter-row shading, and manage the growth of vegetation that may cause shading.
Setting up your PV profile in Glint Solar
Set up PV profiles in Glint Solar for a shortcut to quick, reliable and accurate designs. Create profiles with any and all of the layouts, panels and inverters that you use — including details of the specific panel model, orientation, table and row details, access corridors, AC-DC ratio and losses — and apply them to your designs in click. Profiles let you compare estimated capacity and specific yield with ease and visualise how your site would look in reality.
At Glint Solar we recommend that you rely on PV expertise in setting up profiles. Glint Solar includes some example profiles in the product, however, optimal PV configuration depends on location, specific equipment, company preferences and more. We are very happy to help you set up profiles — especially for users that don't have in-house PV expertise.
PV configuration available in Glint Solar
You can create and edit PV configuration in two places in Glint:
1. In the PV configuration window.
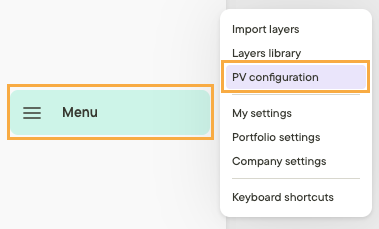
Click on the Menu button in the left side panel and select PV configuration.
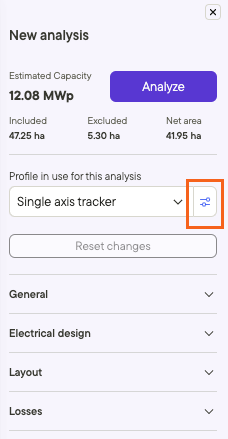
Or click on the speed button to the right of the Profile in use for a new analysis.
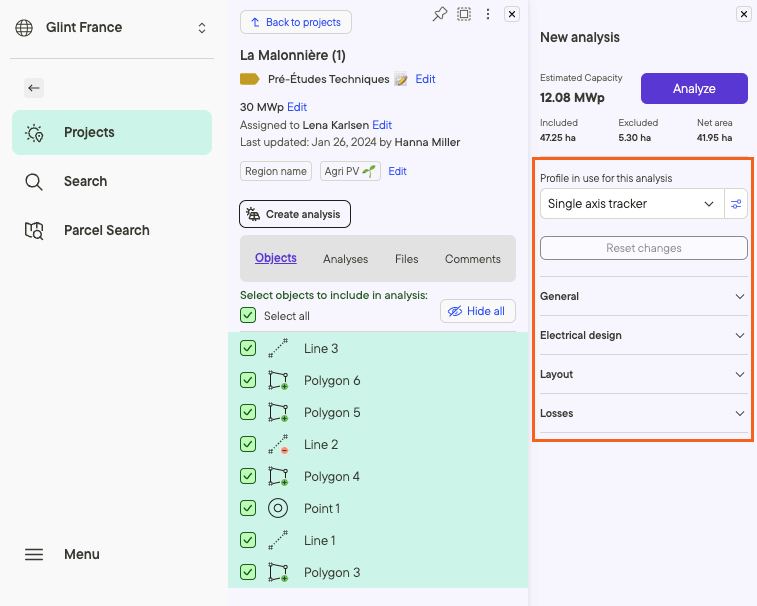
2. When creating a new analysis for a project.
The profile configuration will open in a new modal when you click Create analysis.
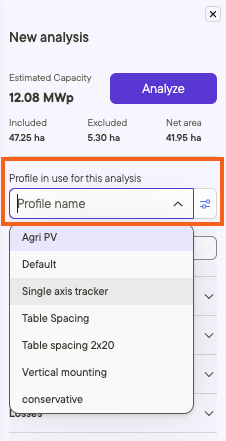
Click on Profile in use for this analysis to choose from existing profiles.
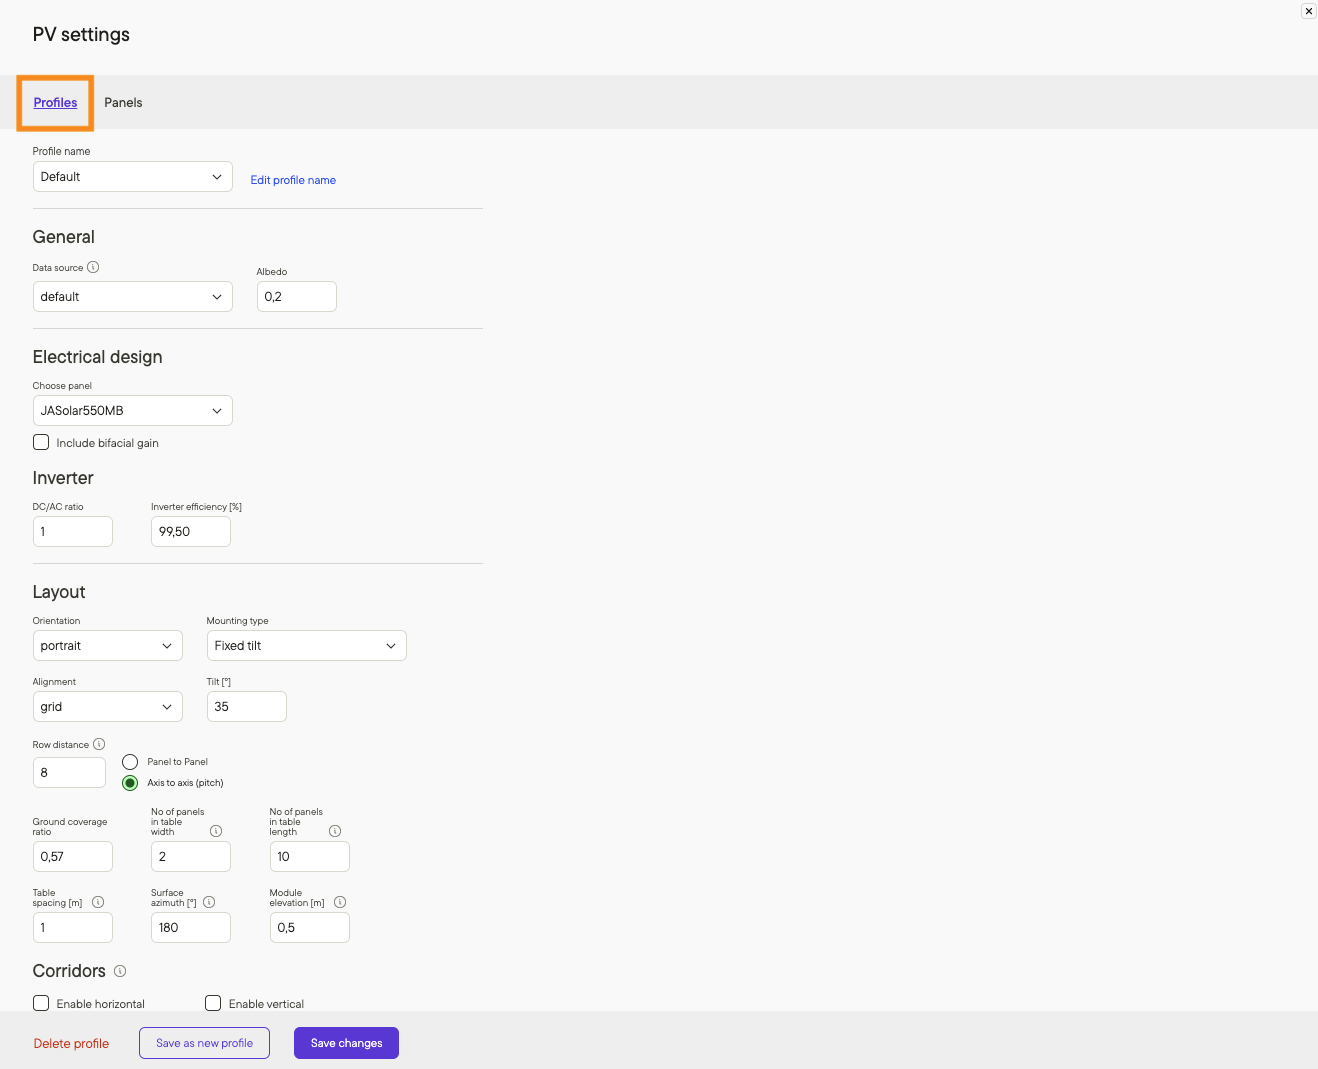
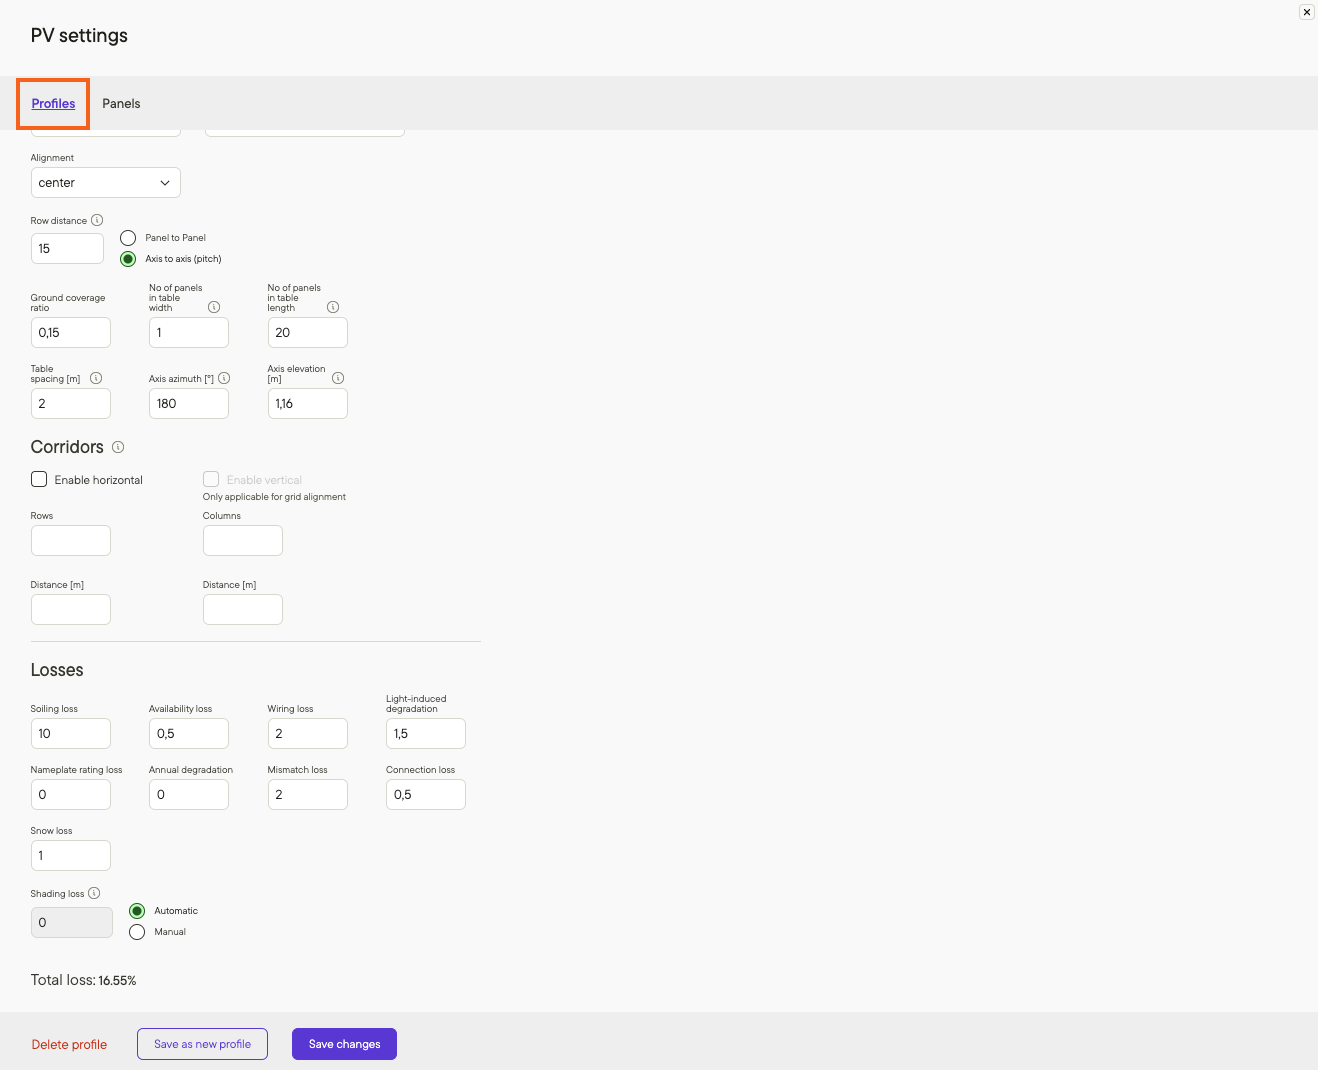
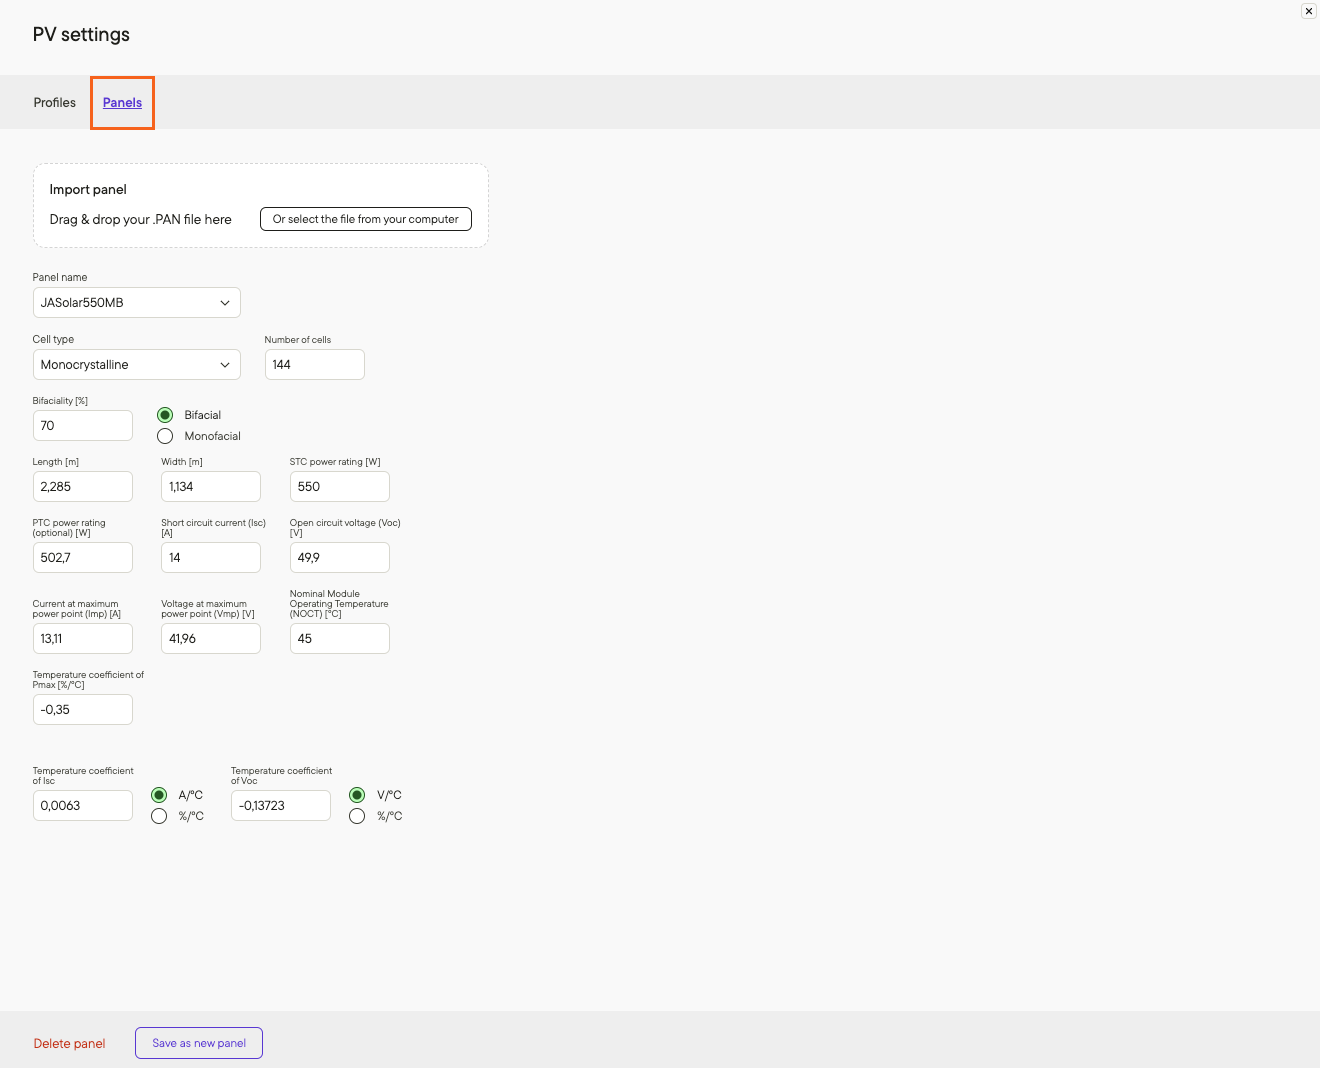
The complete PV configuration appears as below:
| Profiles | Profiles (continued) | Panels |
 |  |  |
Glossary of settings
Profiles
Profile name: Choose or edit the name of your profile.
General
Data source: Select the data source for irradiation and climate data. There are two data origin options in Glint:
- 'default' employs satellite data for irradiation information and ERA5 data for climate details
- 'meteonorm' derives both irradiation and climate data from Meteonorm 8.2.
In the 'default' setting, Glint Solar's proprietary algorithm computes far shading, whereas in the 'meteonorm' setting, far shading data from meteonorm is utilized. Refer PV analysis - Methodology and data sources for further information on data sources.
Albedo: Albedo refers to the reflective properties of the ground surface where solar panels are installed. Albedo measures the fraction of solar energy reflected back into the atmosphere by the ground.
- For grass and agriculture land surfaces, typical values used are between 0.15 and 0.25.
- Glint's recommendation is to use 0.2 by default.
- For areas with snow it is recommended to consider different values for albedos during the year (i.e. snow regions in winter) and make an average.
- Typical albedo values for snow are between 0.6 and 0.8.
Electrical design
Choose panel: Select the panel to be used. Read more about importing .PAN files further down in this article.
- Include bifacial gain: Check this box to include bifacial gain in the analysis calculation.
- Read more about bifacial gain in Equipment and layout, Losses in Glint Solar and PV Analysis - Methodology and data sources.
Inverter DC/AC ratio: This refers to the ratio of the maximum DC (direct current) power that can be supplied by the solar panels to the maximum AC (alternating current) power that can be output by the inverter.
- DC/AC ratios below 1.1 are considered low. DC/AC ratio above 1.3 are considered high.
- In general, a ratio of 1.25 is a good starting point.
DC/AC ratio is a key parameter when designing the site.
- The higher the DC/AC ratio, the more energy is being produced in a year — the higher the annual yield, MWh/year.
- The lower the DC/AC ratio, the higher the energy produced per unit of installed power — higher specific yield, kWh/kWp.
If you expect high fixed costs for your project, then a high DC/AC ratio will be beneficial, as more energy will be produced, so there will be more income to offset the fix costs. DC/AC ratio is also constrained by the area available for development compared to the available grid capacity.
Inverter efficiency [%]: This refers to the percentage of DC power input that is successfully converted into usable AC power output by the inverter. It reflects the effectiveness of the inverter in converting DC electricity generated by solar panels into AC electricity for grid connection or local consumption.
- A value of 97.5% is a good place to start when creating a basic design.
- Inverter efficiency varies not only from inverter to inverter, but also depending on the power output when it is being used. The closer the power output to the nominal power of the inverter, the more efficient it will be.
For example, consider an inverter which has a nominal power (nameplate power) of 300kVA.
- When it is operating at 15kVA, the efficiency is around 96%.
- However, when it is operating at 300kVA, the efficiency is 98.25% (the maximum efficiency).
- Efficiency curves are included in the OND file (a file that inverter suppliers should provide to carry out simulations).
Layout
See Equipment and layout for more detail on the concepts below.
Orientation: Select Portrait or Landscape orientation of the panels.
- For fixed mounting systems, arrangement in portrait is the standard orientation.
- Trackers are always in portrait mode.
The market trend is to use PV modules that are “half-cut”, meaning that the PV module is split in two. So when the lower part of the module is shaded (e.g. early in the morning when shadows are created by the front row of PV tables) the higher part of the module is still producing energy. PV mounting systems are more economic when using portrait arrangement.
Mounting type: Select Fixed tilt, Single axis tracker or East-West mounting for the panels.
As general rules:
- For projects located in lower latitudes and with ample space, a tracker system will be more beneficial. For example, in Spain, Italy, France it is common to use a single axis tracker.
- For projects located in higher latitudes and with more constrained space, fixed tilt systems are more beneficial. For example, projects in northern Germany, UK and Poland projects are normally being built using a fixed system.
- In the same given area, a fixed tilt system allows for more installed DC power compared to a tracker system — however, the specific yield is higher with a tracker system.
- East-West mounting systems are normally used when there is very little space available compared to the intended power that is permitted to be injected. Sites with this arrangement are less efficient.
Alignment: Select centre or grid alignment. Centre alignment optimises the site for the maximum number of panels. Grid alignment optimises the site for minimal cabling.
Tilt [°]: Select the represents the angle at the panels are inclined relative to the horizontal plane. Solar panels have a tilt in order to capture more irradiation.
- For projects in two portrait (2P), typical tilts angles are between 20 and 35 degrees.
- For projects in three portrait (3P), typical title ranges are between 10 and 20 degrees.
Theoretically, the optimal tilt depends on the latitude of the site. In reality, however, more factors are taken into account when designing — such as the spacing between rows of PV tables. There is trade off between optimal theoretical tilt for a specific latitude and the space between rows of tables.
Row distance: Row distance can either be defined as "panel to panel distance" or as "axis to axis distance." Axis to axis is the default in Glint Solar and can also be called "pitch."
- For projects in two portrait (2P), typical pitch ranges between 8.5m and 12m.
- For projects in three portrait (3P), typical pitch ranges between 9.5m and 14m.
Row distances are defined in combination with the tilt angle and the DC power that is targeted to be installed on site.
For sites in which the target is to install the max DC, the minimum panel to panel row distance is that distance required for comfortable maintenance. In general, a minimum distance of 2.5m from panel to panel is required to use small machines to clean the panels.
Ground coverage ratio: GCR represents the proportion of the total land area occupied by solar panels relative to the entire area of the solar park site.
No of panels in table width: The number of panels in table width specifies the quantity of solar panels arranged side by side within a row or table width.
- For fixed systems, typical values are 2 or 3 modules in portrait.
- For trackers, typical values are 1 or 2 modules in portrait.
No of panels in table length: The number of panels in table length specifies the quantity of solar panels arranged end to end within a row or table length.
- The best is to match the table length with the number of modules in series per each string. This makes the site more comprehensive for construction.
- For example, if there are 28 modules per string, then the number of panels in table length should be 28.
Table spacing: Table spacing refers to the distance between individual rows or tables of solar panels.
Surface azimuth [°]: Surface azimuth is the compass direction of the surface upon which solar panels are mounted, affecting the exposure to sunlight throughout the day.
- In most cases, azimuth 180 degrees.
- Some permits may be required to set the azimuth in different angles — for example, to avoid glint and glare at nearby airports.
Module elevation [m]: Module elevation represents the height at which solar panels are installed above the ground, influencing factors such as ground clearance and maintenance access.
- Module elevation for fixed systems is normally between 0.6 and 0.8m. Some module elevation is necessary in case there is grass. In some specific sites floating has to be taken into consideration.
- For trackers, the module elevation depends on the rotation angle. For typical cases the rotation angle is 55 degrees and a minimum module elevation between 0.6m and 0.8m is recommended.
Corridors
Enable horizontal: Click this box to enable corridors that run horizontally (East to West) between tables.
Enable vertical: Click this box to enable corridors that run vertically (North to South) between tables.
Rows: Enter how many rows should be between corridors.
Distance: Enter the width of the corridors.
Columns: Enter how many columns should be between corridors.
Distance: Enter the width of the corridors.
Losses
See Losses for more detail on the concepts below.
Soiling loss: Soiling loss refers to the reduction in energy production due to the accumulation of dirt, dust, or other contaminants on the surface of solar panels, diminishing their ability to capture sunlight effectively in PV power plants.
- Values should be in the range of 1% to 2%.
Availability loss: Availability loss represents the periods during which a PV power plant is not operational or available to generate electricity, often due to maintenance, downtime, or unforeseen events.
- A typical value is 0.2%. This value considers a shutting of the site three times a year for a period of 3 hours each for maintenance or checks.
- Availability loss is sometimes taken into account in the financial model. In this case, it should be set to 0%.
Wiring loss: Wiring loss refers to energy losses that occur in the electrical wiring and connections within a PV system, impacting the efficiency of power transmission from solar panels to inverters and other components.
- Wiring losses should be between 1.5% and 3% if the cabling sizing has been done following best practices and standards.
Light-induced degradation: LID is the phenomenon where solar panels experience an initial reduction in efficiency upon exposure to sunlight, typically occurring in the first few hours or days of operation, after which the degradation stabilizes.
- LID loss is 2% for p-type modules.
- LID loss is 1% for n-type modules.
To know the type of the module being used, please check the datasheet.
- Normally, modules above 650W output are N-type.
- Modules below 650W tend to be P-type.
- N-type modules tend to be favoured for large scale projects as they are more efficient.
In case of doubt, setting the value at 2% is recommended.
Nameplate rating loss: Nameplate rating loss occurs when the actual performance of solar panels falls below their rated capacity, often due to factors such as inefficiencies, shading, or suboptimal operating conditions.
- In most simulations this value is set at 0.3%.
- Ideally, this value is obtained when it is compared the actual performance for each module compared to the tests carried out in the testing facility before being supplied to site.
Annual degradation: Annual degradation represents the expected reduction in the efficiency of solar panels over time, indicating the gradual decline in their performance as they age and experience wear and tear.
- Degradation ranges from 0.5% to 2% depending on the module quality.
- Top quality modules degrade at 0.5% annually.
This value is obtained from the PV module datasheet.
Annual degradation can be calculated by dividing the difference between maximum and minimum guaranteed power by the number of years between those values.

Mismatch loss: Mismatch loss refers to the decrease in overall energy output caused by variations in the electrical characteristics of individual solar panels within a PV array.
- Values ranges from 0.5% to 1.5%.
- Glint recommends using 1%.
Connection loss: Connection loss occurs when electrical connections, such as cables and connectors, experience energy losses, impacting the efficient transmission of electricity within the PV power plant.
- In most simulations this value is set at 0.5%
Snow loss: Snow loss refers to the reduction in energy production during snowy conditions as solar panels become covered by snow, preventing sunlight from reaching the photovoltaic cells.
- Snow loss is very difficult to foresee and calculate with accuracy as it is complicated to determine when the snow is actually going to “leave” or slide from the PV module.
- Many factors are involved: module inclination, snow typology, temperature, etc.
- The maximum typical value is 5% for the worst month, tapering off from November to April.
Total loss: The sum total of all the above losses.
Panels
Glint Solar supports adding four different cell technologies; Monocrystalline, Multicrystalline, Heterojunction (HJT), CIGS and CdTe. Heterojunction modules are treated the same in the energy yield analysis as the Monocrystalline module, which is the standard in the PV industry for now. Note that if you do choose HJT panels, you should set the LID losses to zero in the profile's losses section.
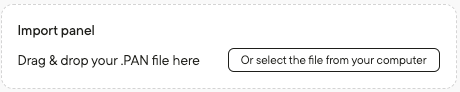
Import panel: To import a panel simply select the .PAN file from your computer or drag and drop it into the space provided.
Panel name: Select or enter the panel name for use in PV profiles.
Cell type: Cell type refers to the technology used in the solar cells of a PV module, such as monocrystalline, polycrystalline, or thin-film, influencing the module's efficiency and cost.
Number of cells: The number of cells in a PV module represents the quantity of individual solar cells connected in series or parallel to achieve the desired voltage and current characteristics.
Bifaciality: Bifaciality in PV modules refers to their ability to capture sunlight from both the front and rear sides, potentially increasing energy yield by utilizing reflected sunlight.
Length [m]: Length specifies the physical dimension of a PV module, representing one of its primary dimensions in meters.
Width [m]: Width specifies the other primary dimension of a PV module, representing its measurement perpendicular to the length in meters.
STC power rating [W]: The Standard Test Conditions (STC) power rating indicates the maximum power output of a PV module under standard conditions, typically measured in watts.
PTC power rating (optional) [W]: The PVUSA Test Conditions (PTC) power rating is an alternative measurement that reflects real-world performance, considering factors like temperature, solar radiation, and wind speed.
Short circuit current (Isc) [A]: Isc is the maximum current that a PV module can produce when its terminals are short-circuited, measured in amperes.
Open circuit voltage (Voc) [V]: Voc is the maximum voltage that a PV module can generate when its terminals are open-circuited, measured in volts.
Current at maximum power point (Imp) [A]: Imp is the current produced by a PV module when operating at its maximum power point, measured in amperes.
Voltage at maximum power point (Vmp) [V]: Vmp is the voltage at which a PV module operates to produce its maximum power output, measured in volts.
Nominal module operating temperature (NOCT) [°C]: NOCT is the temperature at which a PV module is expected to operate under specific conditions, affecting its performance and efficiency.
Temperature coefficient of Pmax [%/°C]: This coefficient represents the percentage change in the maximum power output of a PV module per degree Celsius change in temperature.
Temperature coefficient of Isc: This coefficient represents the rate of change of short circuit current with temperature for a PV module.
Temperature coefficient of Voc: This coefficient represents the rate of change of open circuit voltage with temperature for a PV module.
Additional resources
For more detail on PV configuration, please see the Solar Site Planning Guide.