
The analysis output report
Analysis reports can be generated for both imported projects and those created from scratch in Glint Solar. This article explains how to create an analysis report and what information it contains.
Key points to know about analysis reports in Glint Solar:
- You can create multiple analysis reports for a single project to compare different layouts.
- You can download an analysis report as a PDF to effectively communicate your project's key information.
- You can customize the images included in an analysis report.
- You can add your company logo to the analysis report.
- You can export project objects, panels, and yield data for use in other workflows.
How to create an analysis report
- Open an existing project or create a project from scratch.
- Click Create analysis — this opens a modal window where you can adjust project settings.
- Select the PV profile and configure the project details as needed.
- Click Analyze — the report will be generated in 30–60 seconds.
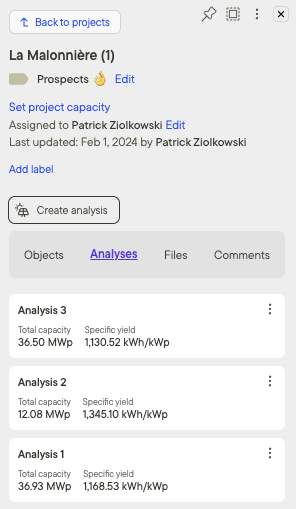
The analysis report will appear under the Analyses tab in the left side window.
- Click on an Analysis to view it.
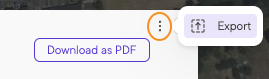
- Click on the overflow menu (the three vertical dots) to rename, export or delete the analysis.
Export an analysis report
You can export the analysis report information in several formats:
- Download as PDF

- Export objects as KML
- Export panels as DXF with georeference
- Export yield as XLSX
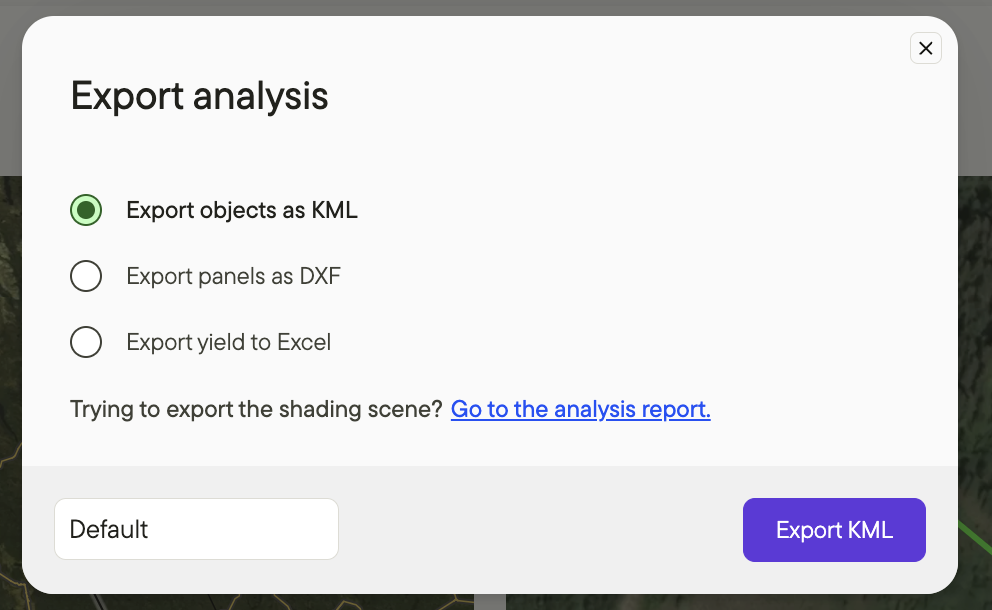
- Export shading scene to PVSyst.

Structure of the analysis report
Location and Coordinates: The town, region, country, latitude, and longitude are shown at the top of the analysis report.
Two images of the site location are included:
- One image shows the project's location within the country.
- One image shows the project objects and surrounding area in 2D.
- Both images can be customized — simply click on an image to edit.
Site visualization: A 3D image shows how the project will look with its specific panel arrangement and site layout conditions.
- This image can be customized — simply click on it to edit.
- The 3D image helps communicate the project's integration with the surrounding area to landowners and authorities, complementing the 2D view.
Site info: Information on the site comprises:
- PV system: Installed capacity, specific yield, number of panels, first year production (P50), P90, and annual variability.
- Geography: Included area, excluded area, net area, and grid connection length.
- Calculation methods: PV framework, irradiation data source, transposition method, climate data source, and irradiation type data.
- Irradiation data: Annual GHI, annual DNI, annual DHI, and annual PoA irradiance.
- Monthly yield: Projected production (GWh) for each month of the year.
- Hourly heatmap: Projected production (kWh) for each hour of each month.
- Losses and gains: Breakdown of irradiation losses and AC/DC losses.
See PV Analysis — Methodology and data sources for a detailed description of Glint's calculations.
Assumptions: Details of the inputs used to create the analysis.
- System specification: Mounting system, ground coverage ratio, tilt, azimuth, PV module orientation, row distance (axis to axis), row distance (panel to panel), PV module row width, PV panel model, PV module elevation, inverter efficiency, panel rated power, DC-AC ratio, inclusion of bifacial gain, albedo, table spacing, table length, and width.
- Manual input losses: Soiling loss, wiring loss, availability loss, connection loss, annual degradation, nameplate rating loss, snow loss, mismatch loss, light-induced degradation, and their total.
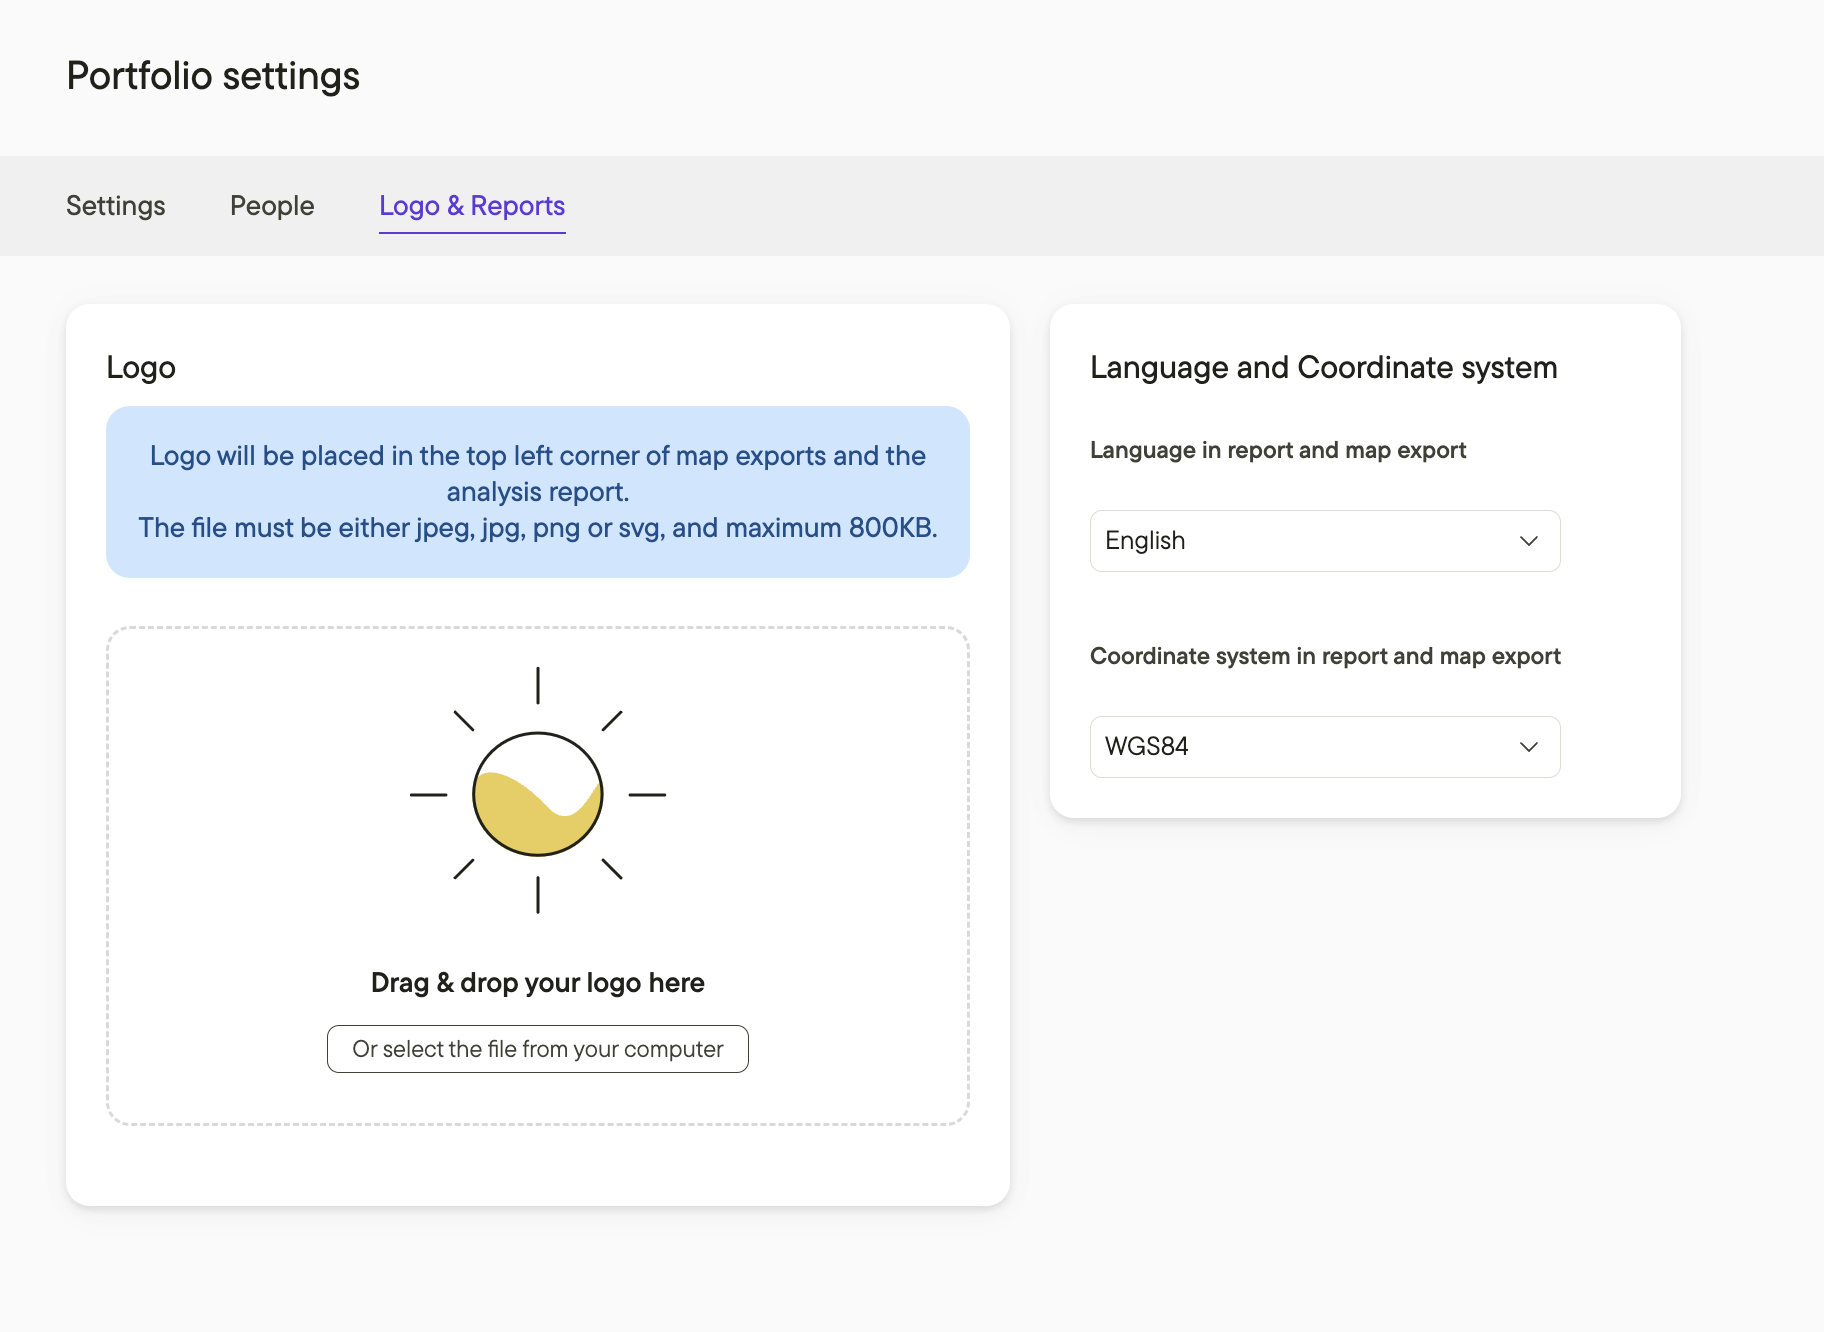
Customize your analysis reports: Add your company logo to your reports to make it clear who produced them.
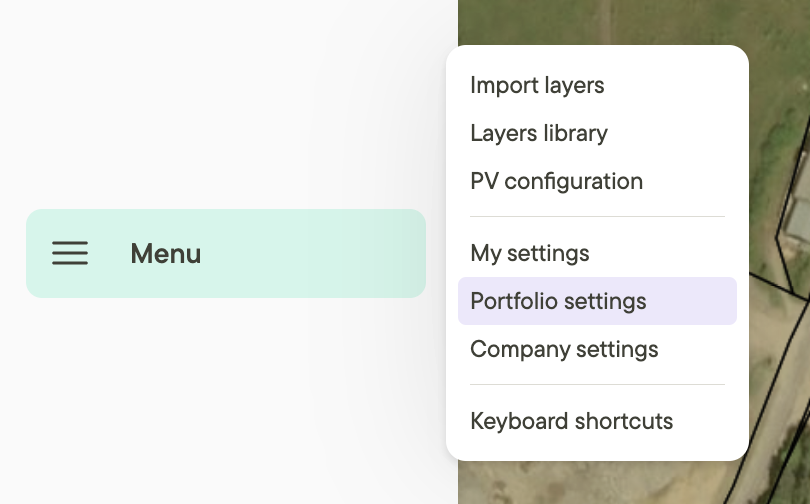
- Click on the Menu button in the left side panel
- Click on Portfolio Settings
- Click on the Logo & Reports tab
- Select a file or drag & drop your company logo.
- You can also choose the language that will be used in the report and map export. Currently, Glint offers English, French, German and Swedish.
- In this tab, you can adjust the coordinate system used in the report and map export, as well.
| 1. Click on the Menu button in the left side panel and select Settings. |
 |
| 2. Click on the Company tab and select a file or drag & drop your company logo. |
 |
| The logo you select will appear in the top left corner of your analysis reports. |
 |
Additional resources
Are you looking for some more guidance on the PV concepts? Check out our Solar Site planning guide!
Want to reap the rewards of Glint Solar quickly? Take a look at Design in a click with Glint Solar.