
BESS Glossary
Nameplate capacity
The nameplate capacity of a battery refers to the manufacturer-specified maximum energy storage or power output of the battery under ideal conditions. It is typically expressed in MWh or kWh.
For example: A 100 MWh BESS can theoretically deliver 100 MW for 1 hour or 50 MW for 2 hours.
While nameplate capacity gives the maximum potential of a battery, real-world performance depends on operating conditions and system management.
Nominal inverter power
Nominal inverter power refers to the rated continuous power output that an inverter can deliver under standard operating conditions. It is typically expressed in kilowatts (kW) or megawatts (MW) and represents the maximum sustained power the inverter can handle without overheating or efficiency loss. It determines the power injection into the grid.
Profile
A profile in the context of a Battery Energy Storage System (BESS) refers to the detailed definition of its setup, including the key features and configuration of the system.
When defining a profile in Glint Solar, it will be required to define the battery, MV station, the operation, distances to configure the BESS set and layout, losses and degradation profile.
Battery and Operation
Battery
A device that stores electrical energy for later use. In the context of BESS site planning, a battery refers to a modular unit or system used to store energy for grid support, load shifting, or backup power.
Cycles
The process of charging and discharging a battery energy storage system. One cycle is completed when the asset is charged to the allowed maximum and discharged to the allowed minimum. A battery's lifespan is determined by the number of cycles it can undergo while upholding satisfactory performance standards. The total lifetime is typically expressed in Full Cycle Equivalents (FCE).
Optimizing the number of cycles per day involves balancing revenue potential with the increased wear and tear on the battery, a crucial factor in lifecycle cost analysis.
Years of operation
In the context of Battery Energy Storage Systems (BESS), years of operation refers to the total duration (typically measured in years) that the system is expected to function effectively while meeting performance and safety requirements. This period is often defined by the system's design life, warranty period, or expected lifespan before significant degradation affects its capacity or efficiency.
The years of operation can be influenced by factors such as:
- Battery chemistry (e.g., lithium-ion, lead-acid, etc.)
- Operating temperature
- Depth of discharge (DoD)
- Charge/discharge cycles
- Maintenance practices
- System usage profile
Manufacturers typically specify an estimated calendar life (years) alongside the cycle life (number of charge-discharge cycles) to give a more comprehensive understanding of the system's longevity.
Project developers carefully consider the warranted years of operation, factoring in degradation rates and replacement costs when modelling the project's financial viability over its life space.
Throughput
The total amount of energy a battery can store and provide throughout a defined period of time (e.g. daily, yearly, lifespan), typically expressed in kilowatt-hours (kWh) or megawatt-hours (MWh). In other words, throughput indicates how many (dis)charging cycles a battery can undergo without major loss of performance.
State of Health
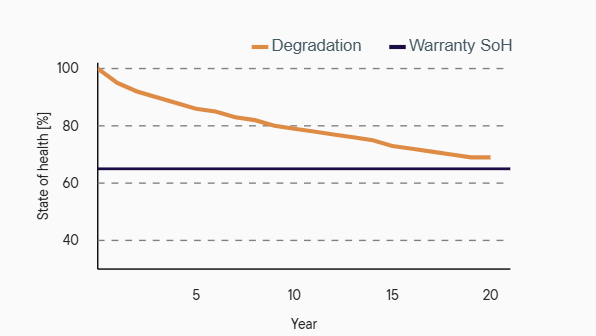
The battery’s ability to retain capacity compared to its rated value before use. SoH signals how much a battery degrades over time.
State Of Charge
The capacity a battery has available for use. SoC indicates how full or empty the battery is.
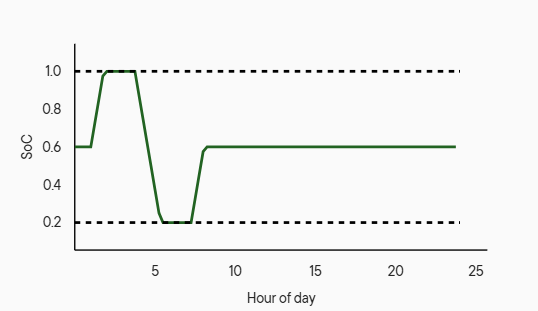
Min SOC: Adhering to the minimum state of charge is critical to prevent irreversible damage to the battery cells, impacting overall system longevity and requiring robust battery management systems.
Max SOC: Respecting the maximum state of charge prevents overcharging, a safety concern and a contributor to accelerated battery degradation.
SOC Profile: A State of Charge (SoC) profile is a graphical or data representation of how the SoC (%) of a battery changes over time based on charging, discharging, and operational conditions. It provides insights into battery utilization. The graph provided in Glint Solar shows how in theoretically the battery is being operated. However, in reality the SOC% and hours of day can differ on daily basis.
A well-managed SoC profile can enhance battery performance, reduce wear, and extend system life in large-scale BESS applications.
C- Rate
Rate at which a battery is charged or discharged, relative to its total capacity. A battery's C-rate indicates how quickly it can supply or absorb energy. Expressed as a unitless value, it typically comes in C/x or xC format, with x signalling how much capacity can be (dis)charged per hour.
Here are some examples:
- C-rate of 1C for a 1 MWh battery:
the asset (dis)charges at a rate of 1 MWh per hour -> it takes 1 hour to (dis)charge fully - C-rate of 0.5C for a 1 MWh battery:
the asset (dis)charges at a rate of 0.5 MWh per hour -> it takes 2 hours to (dis)charge fully - C-rate of 4C for a 1 MWh battery:
the asset (dis)charges at a rate of 4 MWh per hour -> it takes 15 minutes to (dis)charge fully
Battery Degradation
Battery degradation refers to the gradual loss of a battery's ability to hold and deliver charge over time. This process is caused by chemical and physical changes within the battery. Degradation results in reduced capacity, lower efficiency, increased internal resistance, and shorter overall lifespan. Factors that accelerate battery degradation include high temperatures, deep discharges, overcharging, and frequent charge-discharge cycles.
Degradation Graph
A battery degradation graph is a visual representation of the decline in a battery’s capacity, efficiency, or performance over time or charge-discharge cycles. It typically shows how the battery's state of health (SoH), remaining capacity, or efficiency decreases due to aging and usage.
Capacity at POC
Capacity at the Point of Connection (PoC) refers to the maximum power output that the overall system can deliver to the electrical grid or a designated load at its grid interconnection point. It is a critical parameter in large-scale energy storage projects and is influenced by system design, grid requirements, and operational constraints. For example, a 100 MW / 400 MWh BESS connected to the grid might have a Point of Connection capacity limit of 80 MW due to grid constraints, meaning it cannot discharge more than 80 MW at any given time, even though its inverters and battery packs could theoretically support 100 MW.
MV Station
A Medium Voltage (MV) station contains a range of electrical components, including inverters, transformers, electric cabinets, switchgear, and various auxiliary systems. Some suppliers include the inverters inside the battery container or outside next to the MV Station.
BESS set
A Battery Energy Storage System (BESS) setup is defined by the number of containers and Medium Voltage (MV) stations it includes.
Each set has a defined energy capacity (result of multiplying the capacity of each battery by the number of batteries) and MV power.
A BESS set is defined by the equipment, the layout arrangement (amount of equipment and the corresponding distances)

Set and Layout Definition
Battery Columns
Battery columns are the vertical arrangement of battery units in a set. They determine the BESS set's physical dimensions and influence electrical connections and cooling. The number of columns contributes to the overall capacity.
Battery rows
Battery rows are the horizontal arrangement of battery units in the set. Combined with columns, they define the total number of batteries in a set. This is essential for space planning and cost estimation.
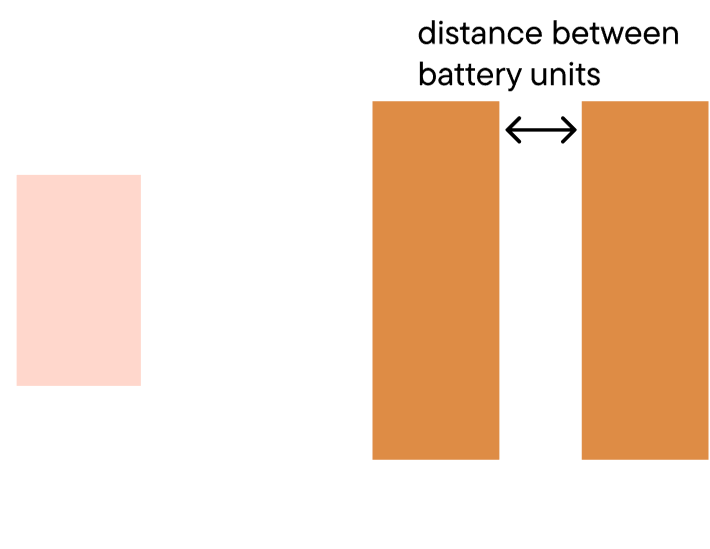
Distance between battery units
This is spacing between individual batteries is crucial for ventilation, cooling, and maintenance access. Proper spacing prevents overheating and ensures safe operation.
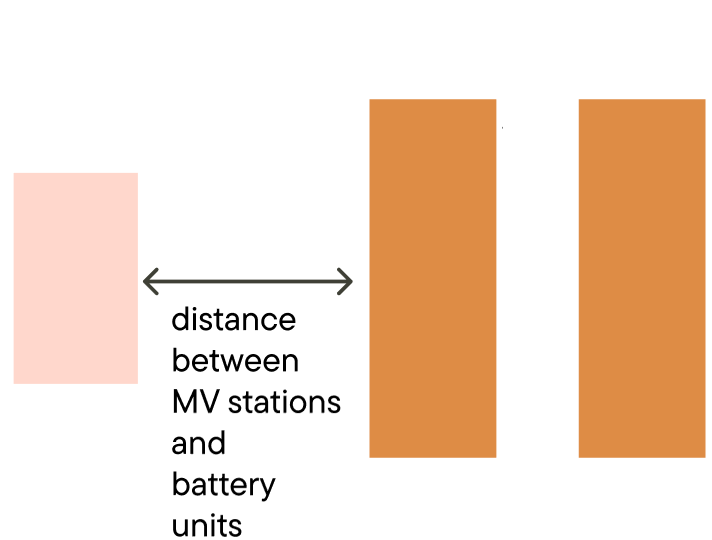
Distance between battery units and MV Station
The distance between battery units and the MV station affects DC cabling length, impacting both cost and power loss. Optimizing this distance balances minimizing losses with practical
considerations like maintenance and safety.
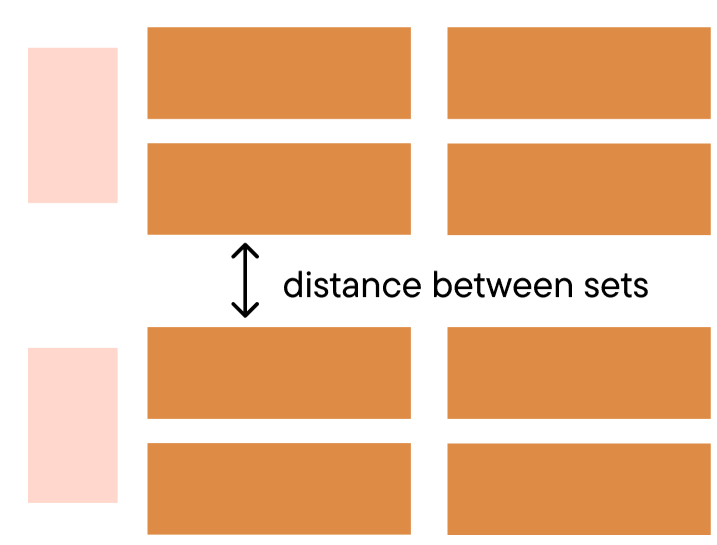
Distance between sets
This distance separates individual BESS sets for safety, maintenance, and incident prevention. It also influences how sets are electrically connected.
Front row distance for sets
The front row distance is the setback from a reference point like a wall. It's determined by safety regulations and allows for access and ventilation.

Back row distance for sets
Similar to the front row, this is the setback from a reference point behind the batteries. It ensures space for maintenance and ventilation.

Mirror rows for sets
Mirror rows inverts every other row of batteries. This means that for each row the MV system will face the MV system for the next row - and the batteries will face the batteries on the other side.


Flip rows for sets
Flip rows inverts all rows of batteries, including those already mirrored. This means where two rows had their MV systems facing each other will now have their batteries facing each other instead.
Cable losses:

Cable losses refer to the energy loss that occurs in the electrical cables during the transmission of power from the batteries to the point of connection. These losses are caused by the resistance of the cables and the current flowing through them. For a BESS project a range in between 2% to 7% is standard. However, this might differ a lot depending on the design, location, length of transmission line, working voltages, etc.
Auxiliary losses:
This refer to the energy consumed by supporting systems that are necessary for the operation, monitoring, and safety of the battery storage facility. These losses do not contribute directly to energy storage or discharge but are essential for maintaining system efficiency, reliability, and safety. Main components that requite energy consumption are cooling systems, Battery Management System (BMS), control electronics, fire suppression, safety systems, lighting and general facility loads. Higher auxiliary losses lower the overall efficiency of the BESS.
Battery profiles
Battery weight
The weight of a battery container refers to the total mass of the container itself, which houses and protects the batteries
Typical weight for a 5MWh 20ft container is around 42 tones.
The weight of a battery container is critical, especially during transport, as heavy loads may require specialized trucks, reinforced trailers, or compliance with weight regulations. Some large battery shipments, particularly lithium-ion batteries, may also fall under hazardous material transport rules, necessitating extra safety precautions and certified carriers.
When installing large battery containers, proper foundation design is essential to support the weight and ensure structural stability. Foundations must be designed based on geotechnical data, including soil bearing capacity, settlement potential, and environmental conditions. Inadequate foundation design can lead to structural failures, uneven settling, or instability, affecting both safety and long-term performance.
Battery Cooling system
A battery cooling system for large battery containers is designed to manage and regulate the temperature of batteries to ensure optimal performance, longevity, and safety. When batteries, especially large-scale energy storage systems or electric vehicle (EV) batteries, operate, they generate heat due to internal resistance, charging/discharging cycles, and high power densities. Excessive heat can degrade battery life, reduce efficiency, or even cause dangerous conditions like thermal runaway. A cooling system helps maintain the temperature within the recommended range for the specific battery.
Main cooling systems are:
i) Air cooling
Uses natural airflow to cool the battery. It is simple and cost-effective but limited in its cooling capacity. This method relies on the surrounding air to dissipate heat, which means it is less efficient in extreme temperatures or during high-demand scenarios.
ii) Liquid cooling
Liquid cooling uses a coolant (often a mixture of water and glycol) that circulates through pipes or cooling plates attached to the battery cells. The coolant absorbs heat from the batteries and transports it to a heat exchanger or external cooling system.
Liquid cooling systems are more efficient than air cooling, especially for high-capacity battery containers, as they can manage higher heat loads and maintain a uniform temperature across all cells
iii) Hybrid Cooling system
An hybrid Cooling System refers to a combination of two or more cooling methods—typically air cooling and liquid cooling
Battery Max C-Rate
The Maximum C-Rate of a battery refers to the highest charge or discharge rate that the battery can safely handle without causing damage, overheating, or reducing its lifespan.
The maximum C-rate is critical in applications like EVs and grid storage where high charge/discharge rates impact performance and longevity.
Suppliers often offer reduced warranties for systems that operate at high C-rates due to the increased stress placed on the battery. The faster the charge or discharge rate, the greater the risk of thermal stress, capacity degradation, and shorter lifespan, which can lead to more frequent replacements and maintenance costs. Therefore, systems operating at high C-rates may face more limited warranty terms to account for these potential issues.
Battery Shelf degradation
Battery shelf degradation or battery calendar aging refers to the gradual loss of a battery's capacity and performance over time when it is stored and not in use. This degradation occurs due to chemical reactions within the battery, even when it is not actively discharging or charging.
Factors Affecting Shelf Degradation:
i) Self-Discharge Rate: Batteries naturally lose charge over time, with some chemistries degrading faster than others.
ii) Storage Temperature: Higher temperatures accelerate degradation by increasing internal chemical reactions. Storing lithium-ion batteries at 40°C (104°F) can reduce lifespan significantly compared to storage at 20°C (68°F).
iii) State of Charge (SoC) during storage: Storing at 100% charge can stress the battery, leading to faster capacity loss.
In regards to Lithium-ion degrades faster when stored at full charge and high temperatures.
Understanding shelf degradation helps maximize battery lifespan and efficiency, especially in applications where long-term storage is required.
MV Station Profiles
MV Container size
An MV (Medium Voltage) Station Container is a prefabricated enclosure that houses medium-voltage electrical equipment such as switchgear, transformers, protection systems, and auxiliary power supplies. The size of the container depends on the power rating and number of components.
MV Station Weight
The weight of MV Station refers to the total mass of the container itself, which houses and protects the components inside.
Typical weight for a 5MW 20ft container is around 18 tonnes, containing a middle voltage transformer, inverters and electrical cabinets.
The weight of a MV Station container is critical, especially during transport, as heavy loads may require specialized trucks, reinforced trailers, or compliance with weight regulations.
Inverter EURO efficiency
Euro Efficiency is a weighted efficiency measure used to evaluate the performance of solar (PV) inverters under varying load conditions. Unlike peak efficiency, which only considers the inverter’s best-case scenario, Euro Efficiency provides a more realistic efficiency value by factoring in different operating conditions throughout the day.
Transformer Efficiency:
Transformer efficiency is the ratio of the useful output power to the input power, expressed as a percentage. It is given by the formula:
η=(Output Power/Input Power)×100%
Since transformers primarily operate on electromagnetic induction and have minimal moving parts, they tend to be highly efficient. However, some energy is lost due to factors like copper losses (winding resistance), core losses and stray losses.
Typical Transformer Efficiencies:
- Small Transformers (1-10 kVA): 85% - 95%
- Medium Transformers (10-500 kVA): 95% - 98%
- Large Power Transformers (500 kVA+): 98% - 99.75%
- High-Efficiency Transformers (e.g., modern grid-scale units): Up to 99.85%
Additional resources
For more detail on BESS configuration, please see the articles below: